Risk Adjustment Overview
A Practical Guide to HCC, RAS, and Manual Risk Scoring (V28)
September 30, 2025

Risk Adjustment Overview
A Practical Guide to HCC, RAS, and Manual Risk Scoring (V28)
September 30, 2025
Risk adjustment determines how Medicare Advantage plans are paid by estimating each enrollee’s expected healthcare costs using demographics and diagnoses. The current CMS model version, CMS-HCC Model V28, introduces important mapping and coefficient changes that materially affect RAFs (Risk Adjustment Factors) and plan revenue. This guide explains the concepts and systems (RAS) and gives a V28-aware manual scoring workflow you can use for auditing and training.
Risk adjustment is CMS’s statistical method to align payments with beneficiary risk. It is prospective: diagnoses collected during a data-collection year are used to predict costs in a subsequent payment year. Inputs include demographics (age/sex/dual status) and diagnoses mapped to HCCs; the result is a numeric risk score (RAF), where >1.0 = expected cost above average and <1.0 = below average.
CMS periodically updates the HCC model. V28 (the 2024/2025 model release commonly called V28) reconfigures HCCs to reflect ICD-10-CM and newer utilization patterns, expands the number of payment HCCs, and applies constraining (related HCCs sharing coefficients). Because of these changes, many prior examples and coefficients no longer apply — always use the official V28 mapping and coefficient files from CMS.
Key V28 points:
V28 expanded payment HCCs (V24 → V28: ~86 → 115 HCCs) and reorganized mappings.
V28 applies constraining in several HCC families (many related HCCs now share coefficients). This reduces volatility but changes RAF impacts per condition.
CMS implemented V28 via a phase/blend schedule for payments (check the Rate/Advance Announcement for the model blend and normalization instructions for your payment year).
CMS ingests diagnoses from:
RAPS — legacy feed (now limited; used mainly for PACE in many contexts).
EDPS — encounter-level data, broadly adopted since 2014; provides richer encounter detail.
Fee-for-Service / IDR — FFS claims stored in CMS’s Integrated Data Repository; used because beneficiaries move between MA and FFS.
Understand which flows apply to your members — mappings and eligibility rules differ by source and affect what maps into V28 payment HCCs.
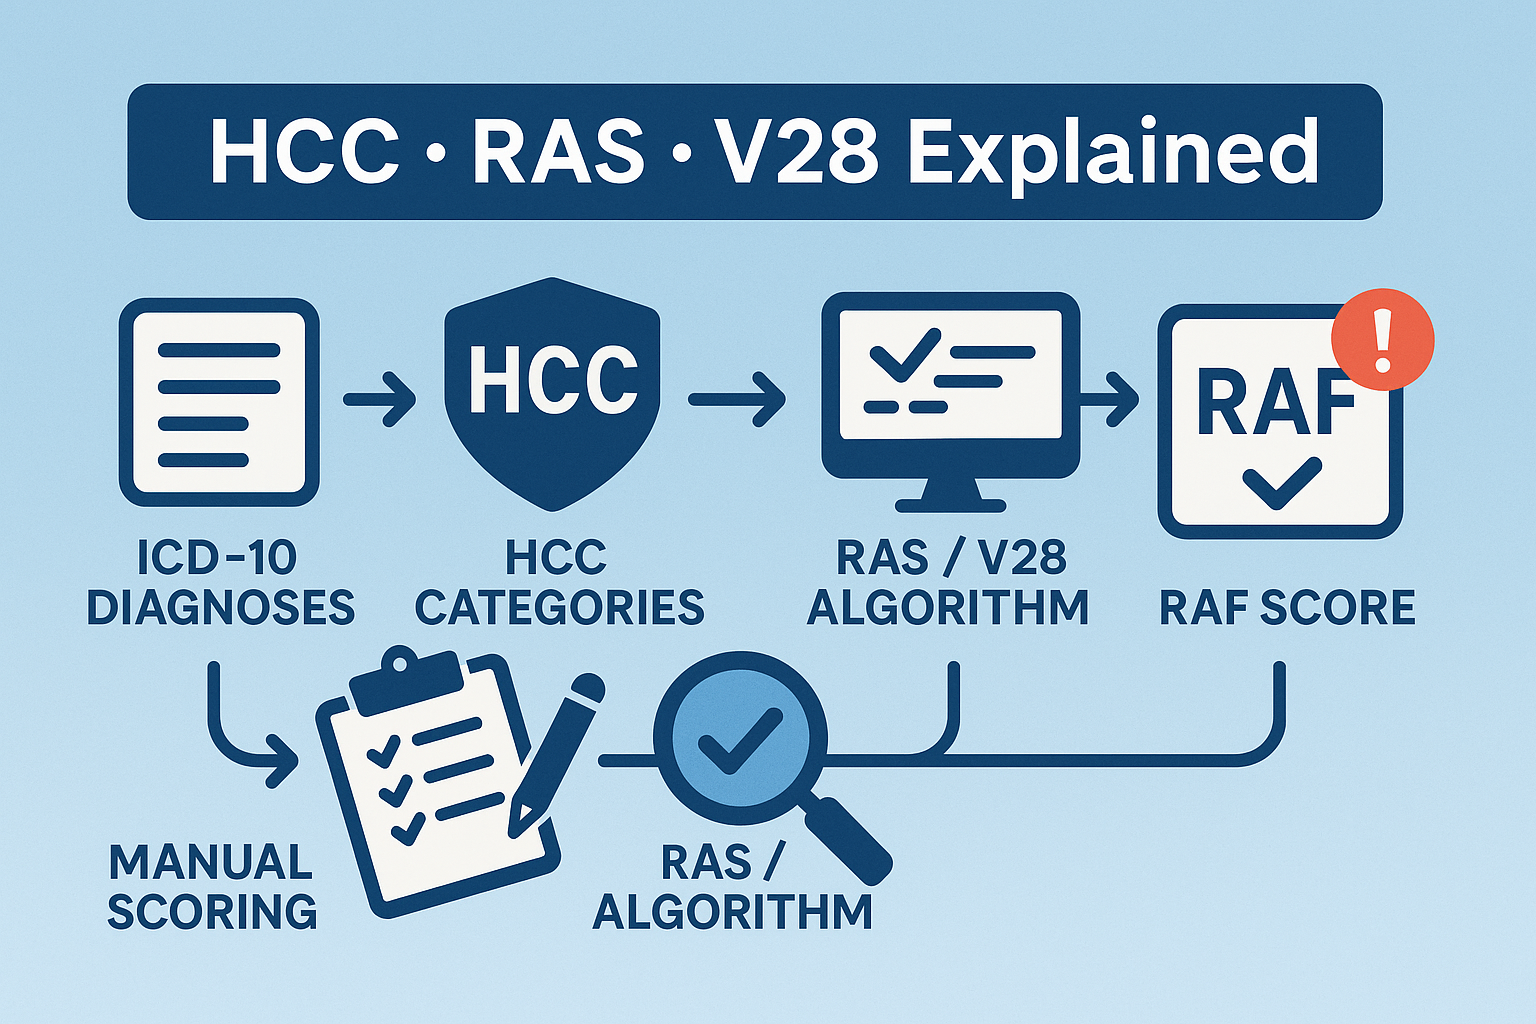
V28 follows the same high-level mechanics as prior HCC models, but with revised mappings and coefficients:
Map ICD-10 → V28 payment HCCs using CMS V28 ICD→HCC mapping files.
Apply V28 hierarchy rules — in a disease family, only the retained payment HCC counts (V28 preserves hierarchy logic; constraining may cause related HCCs to share coefficients).
Sum relative factors — demographic cell + retained HCC factors + interaction terms + payment-HCC count factors = raw risk score (V28 coefficients must be used).
Apply final adjustments — divide the raw score by the normalization factor for the model/denominator year, then multiply by (1 − MA coding pattern adjustment) per the Rate Announcement for your payment year / model blend. (Normalization & coding adjustments are published in CMS Advance/Rate Announcement materials.)
Important: because V28 changes mappings and coefficients, numeric examples built under earlier models will likely produce different RAFs under V28.
Use this workflow to audit automated scoring under V28. Wherever you publish numbers on your site, insert the exact V28 table rows (ICD→HCC mapping row, coefficient table row, hierarchy reference) — I can extract those for you.
High level steps
Map ICD-10 codes → V28 payment HCCs (use the V28 mapping ZIP from CMS).
Apply V28 hierarchy rules and drop dominated HCCs (note V28 constraining).
Retrieve V28 relative factors from the coefficient tables (demographic cell, HCC(s), interaction(s), HCC count factor) and sum them → raw score.
Normalize & apply MA coding pattern adjustment (use normalization & MA coding adjustment values published for the payment year / blend you are calculating under).
Example beneficiary (same demographics to be computed under V28):
Female, 76 years old
Community resident (not institutionalized)
Non-dual (not Medicaid eligible)
Not disabled
Steps to compute the V28 RAF for this beneficiary:
Identify the ICD-10 codes submitted.
Use the CMS V28 ICD→HCC mapping file to map each code to a V28 payment HCC (or determine if it no longer maps to a payment HCC).
Apply V28 hierarchy rules and determine which HCC(s) remain after hierarchies and constraining.
Pull the V28 coefficient table rows for the beneficiary’s age/sex cell, each retained HCC, any disease interaction, and the payment-HCC count factor; sum → raw score.
Obtain the correct normalization factor and MA coding pattern adjustment from the CMS Rate/Advance Announcement applicable to your payment year / model blend; apply to raw score → final V28 RAF.
Illustrative V28 Worked Example (audit-ready, cited)
Below is an illustrative, fully worked V28 example you can paste into the blog. It demonstrates the pipeline from demographics → HCCs → interaction → normalization → MA coding adjustment, with digit-by-digit arithmetic and citations. This is illustrative (HCC choices and some coefficients drawn from public vendor & CMS examples). If you want the exact calculation for specific ICD codes, I will compute that next using the CMS V28 mapping/coefficient files and provide file/sheet/row citations.
Assumptions & sources
We use realistic V28 coefficients published in CMS or industry worked examples. Where I reference a specific coefficient or factor, it’s cited to CMS or a reputable industry resource.
Example beneficiary (V28)
Female, 76 years old (age bracket 75–79) — community resident, non-dual, not disabled.
V28 coefficients used (sources):
Age/sex factor (Female, 75–79): 0.1949.
Diabetes (V28 constrained coefficient): 0.166.
Chronic systolic CHF (V28 example HCC): 0.360.
Atrial fibrillation (V28 example HCC): 0.299.
Disease interaction — Diabetes + CHF: 0.112.
Payment-HCC count factor for 4 HCCs: 0.000 (no additive factor for exactly 4 in the referenced tables).
Normalization factor (V28 model example): 1.045.
MA coding pattern adjustment (example statutory/minimum): 0.0590 (5.90%).
Step 0 — list the numeric inputs:
Age/sex (F, 75–79) = 0.1949.
Diabetes (V28) = 0.166.
CHF (V28 example) = 0.360.
Atrial fibrillation (V28 example) = 0.299.
Interaction (Diabetes + CHF) = 0.112.
Payment-HCC count factor for 4 HCCs = 0.000.
Normalization factor (V28 model) = 1.045.
MA coding pattern adjustment = 0.0590 (i.e., multiply by (1 − 0.0590)).
Step 1 — compute RAW RISK SCORE (sum of demographics + HCCs + interaction + count):
Age/sex: 0.1949
- Diabetes: 0.166 → subtotal = 0.3609
- CHF: 0.360 → subtotal = 0.7209
- Atrial fibrillation: 0.299 → subtotal = 1.0199
- Interaction (Diabetes+CHF): 0.112 → subtotal = 1.1319
- Payment-HCC count (4 HCCs): 0.000 → RAW risk score = 1.1319.
Step 2 — divide by normalization factor (1.045):
1.131900 ÷ 1.045 = 1.0831578947368423… → round to 3 decimals → 1.083.
Step 3 — apply MA coding pattern adjustment (5.90%): multiply by (1 − 0.0590) = 0.941
1.0831578947368423 × 0.941 = 1.0192515789473686… → round to 3 decimals → 1.019.
Final V28-adjusted RAF (rounded to 3 decimals): 1.019
Interpretation: Under this illustrative V28 example (specific HCCs and coefficients above), the beneficiary’s final RAF ≈ 1.019 — roughly 1.9% above the average (RAF = 1.000). Replace input HCCs / coefficients with the exact V28 rows for your precise sample to produce a production-ready table.
CMS Risk Adjustment / V28 model downloads (ICD→HCC & model files)
CMS Model Software & ICD-10 Mappings (2025)
CMS Model Software & ICD-10 Mappings (2024)
CMS Advance/Rate Announcement — normalization factors & MA coding-pattern adjustment
CY 2025 Rate Announcement (PDF)
CY 2026 Rate Announcement (PDF)
Age/sex cell values (Female 75–79 = 0.1949) from V28 tables
CMS Risk Adjustment Technical Specifications 2025 (PDF)
Always use official V28 files from CMS as the source of truth.
Watch for constraining: V28 constrained many related HCCs to share coefficients. That can reduce the RAF impact of moving among more granular subcodes.
Check model blending in the Rate Announcement — CMS may use a V28/V24 blend for particular payment years; use the stated blend weights and correct normalization factors.
Avoid transcription errors (I vs 1, trailing spaces, code formatting) — small errors break mapping lookups.
Build an auditable trail: for every HCC you publish, save the exact CMS file name, sheet/tab, and row number used as the evidence.
CMS Risk Adjustment landing (Model Software & V28 downloads) — official V28 mapping & coefficient files
CMS Model Software & ICD-10 Mappings (2025)
CMS Model Software & ICD-10 Mappings (2024)
CMS Advance / Rate Announcement — normalization factors, MA coding pattern adjustment, and model blending details
CY 2025 Rate Announcement (PDF)
CY 2026 Rate Announcement (PDF)
2026 Medicare Advantage & Part D Advance Notice Fact Sheet
CMS technical reports & implementation guides — description of V28 changes and HCC reconfiguration
CMS Risk Adjustment — Other Model Related Documents
CMS Risk Adjustment Technical Specifications 2025 (PDF)
Q: Has V28 already been used for payments?
A: CMS has phased V28 in via blends for recent payment years (check the Rate/Advance Announcement for the exact blend used in your target payment year).
Q: Will RAFs generally go up or down under V28?
A: Many industry analyses and CMS documentation indicate average RAFs decline for many beneficiaries under V28 (fewer codes map to payment HCCs and constraining reduces some coefficients), but the net effect varies by population and the model-blend/normalization used for your payment year. Always compute using V28 and the correct normalization/coding adjustments.
Q: Where are the V28 mapping & coefficient files?
A: On the CMS risk-adjustment pages (Model Software / ICD-10 Mappings for 2024/2025/2026).
A Complete Training Guide for Medicare Advantage Data Teams
Every Medicare Advantage (MA) plan’s risk score and payment accuracy depend on one thing: clean, timely encounter data.
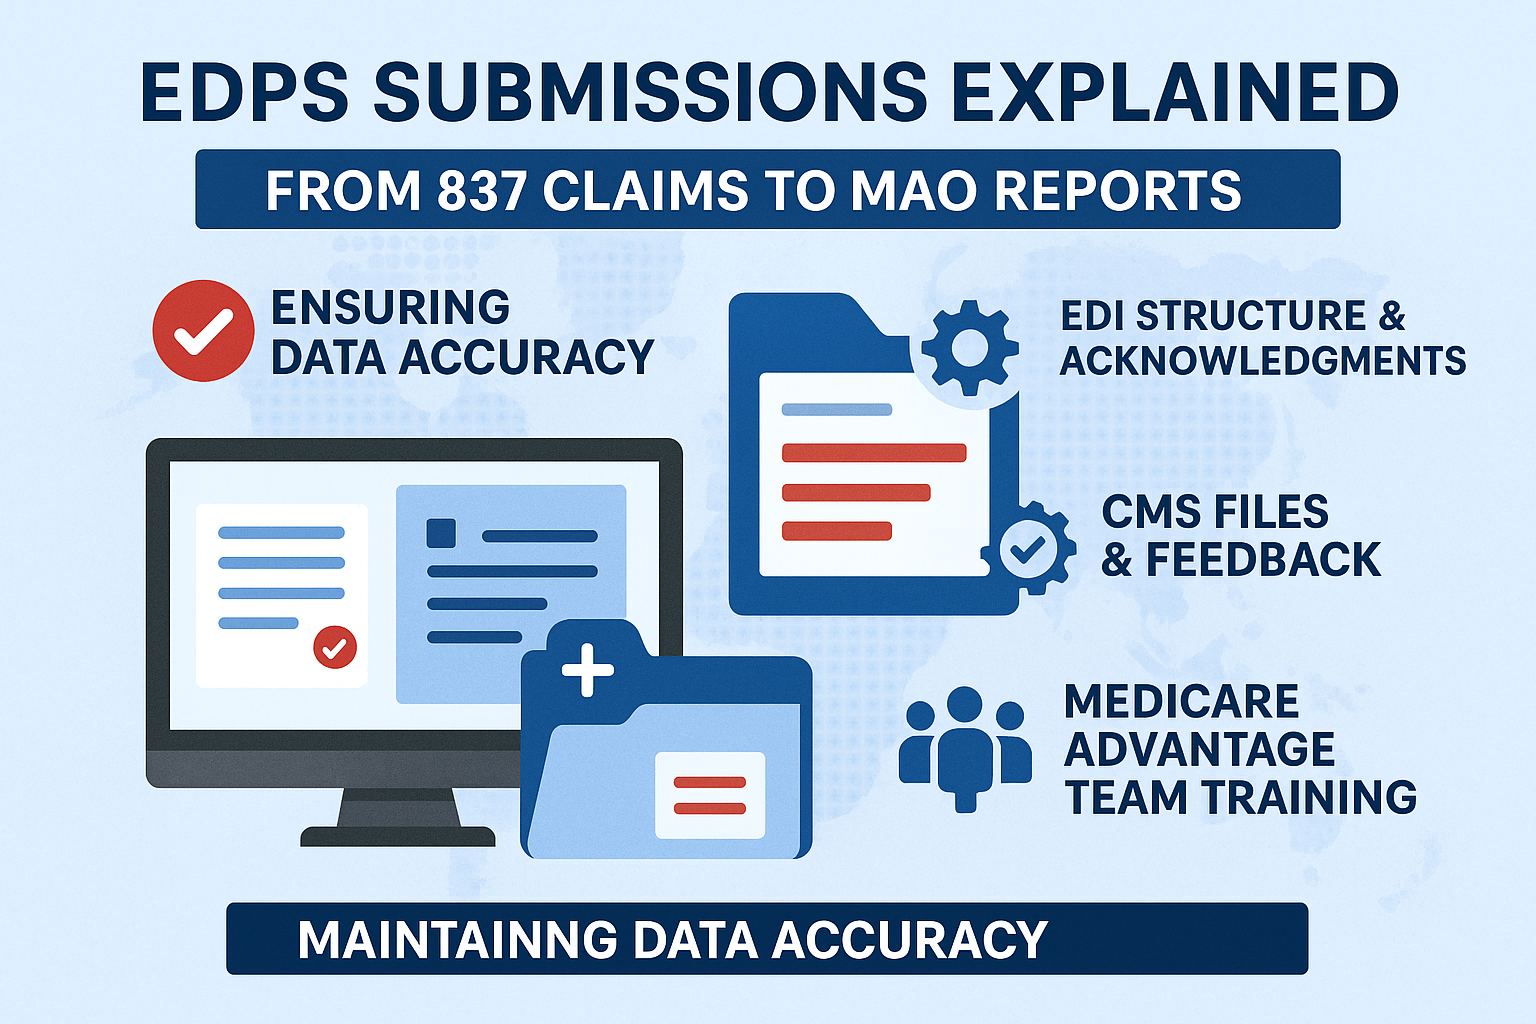
The Encounter Data Processing System (EDPS) is how MAOs transmit encounter (claim) information to CMS for validation, storage, and use in Risk Adjustment Suite of Systems (RASS) model runs.
Understanding EDPS — along with the 837 EDI structure, acknowledgment reports (999, 277CA), and CMS feedback files (MAO-001, MAO-002) — is essential for:
Data operations teams ensuring connectivity and compliance
Risk adjustment analysts validating submission quality
Compliance and audit staff maintaining traceability across the RASS ecosystem
EDPS is the CMS system that processes encounter data submitted by Medicare Advantage Organizations (MAOs).
Encounter data represents adjudicated claim-level details (Professional, Institutional, and DME) from providers for MA beneficiaries.
These submissions are used by CMS to:
Calculate risk scores for payment
Calibrate and refine HCC model versions (e.g., V28)
Perform utilization, quality, and cost analyses
EDFES (Front-End System)
Validates HIPAA compliance, syntax, and envelope structure before data reach EDPS. This ensures only properly formatted encounter files move forward for processing.
EDPS Core Processor
Performs business and content validation, applies CMS-defined edits, and flags preliminary Risk Adjustment (RA) indicators for eligible diagnoses and services.
EODS (Encounter Operational Data Store)
Stores all accepted encounter data after processing. The EODS is the official CMS repository used for reporting, analytics, and downstream model runs.
MAO Reports (MAO-001 & MAO-002)
MAO-001 — Identifies duplicate encounter data detected during processing (triggered by error 98325 – Service Line(s) Duplicated). It provides detailed duplicate line items for correction or resubmission.
MAO-002 — Provides encounter-level processing results from EDPS, including acceptance or rejection details and preliminary Risk Adjustment (RA) flags such as PA, PD, PN, or FR.
CMS transitioned from summary-level RAPS submissions to detailed encounter data to improve accuracy in:
Risk score calculation
Program integrity and auditability
Clinical and cost analyses
EDPS data feeds directly into the Risk Adjustment Suite of Systems (RASS), where the risk adjustment model converts diagnoses into HCCs for payment.
All organizations offering Medicare Advantage coverage, including:
MA Plans and MA-PDs
SNPs (Special Needs Plans)
Regional & Local PPOs
Employer Group Waiver Plans (EGWPs)
PACE, Cost, and MSA plans
Religious Fraternal Benefit and PSO plans
For each plan type, CMS requires different encounter data submissions:
MA / MA-PD Plans — Must submit all adjudicated (accepted and denied) claims according to CMS specifications.
PACE Plans — Submit claims-based encounters only.
Cost Plans — Submit only Medicare-covered items or services for which costs are claimed on CMS Cost Reports.
SNPs (Special Needs Plans) — Submit Medicare services following EDS guidelines.
CMS sets specific deadlines for encounter data submissions:
Full Encounter — Must be submitted within 13 months of the Date of Service (DOS).
Correct/Replace or Void/Delete Encounter — Must be submitted within 13 months of DOS and no more than 30 days after the adjustment date.
Chart Review Encounter — Must be submitted within 25 months of the data collection period.
Before sending data, MAOs must:
Complete the Encounter Data EDI Agreement with CMS (via CSSC).
Establish secure connectivity using Connect:Direct, TIBCO, or Gentran.
Test and certify using EDFES test environments before production go-live.
Electronic Data Interchange (EDI) enables the digital exchange of structured data between healthcare entities.
It replaces paper workflows, allowing providers to submit, and payers to receive, standardized claims.
ASC X12 is the U.S. national standard for EDI healthcare transactions.
Common File Types:
• 837 — Healthcare Claim
Used by providers to submit Professional, Institutional, or Dental claim data to payers. This is the main file for transmitting encounter and billing details.
• TA1 — Interchange Acknowledgment
Confirms that the EDI file was received successfully and checks for envelope-level or formatting issues (e.g., ISA/GS segment errors).
• 999 — Implementation Acknowledgment
Verifies that the submitted EDI file meets syntax and structural standards. A failed 999 means the file will not move forward to claim-level validation.
• 277CA — Claim Acknowledgment
Provides business-level feedback for each individual claim — indicating whether it was accepted, rejected, or pended after processing.
ISA → GS → ST → LOOP → SEGMENT → ELEMENTHierarchy:
ISA/IEA — File envelope
GS/GE — Functional group
ST/SE — Individual transaction set (one claim)
Loops (1000–2400) — Logical sections (submitter, patient, claim, service line)
Segments (NM1, REF, DTP) — Data lines within loops
Elements — Actual data fields
Example:NM1*41*2*Health Payer System*****46*TGJ23~
→ identifies the billing provider submitting the claim.
1000 -> ASubmitter Information
1000B -> Receiver (CMS or Clearinghouse)
2000A -> Billing Provider Hierarchy
2000B -> Subscriber/Patient Info
2300 -> Claim Details
2400 -> Service Line Details
837 claim is submitted by MAO or clearinghouse
TA1 confirms receipt and envelope validity
999 validates syntax and structure
277CA provides claim-level acceptance or rejection status
MAO-001 / MAO-002 reflect EDPS and CMS processing outcomes
Confirms structural validity of an EDI 837 file.
Key Segments:
AK1 / AK2 -> Group & Transaction Acknowledgment
IK3 / IK4 -> Identify segment and element with errors
IK5 -> Final acceptance code (A = Accepted, E = Accepted w/Errors, R = Rejected)
Remember:
If your file fails at the 999 stage, it never reaches CMS for adjudication.
Common 999 Errors:
Invalid ISA/GS control numbers
Mismatched ST/SE pairs
Invalid NM1 or CLM segments
Tracks each individual claim within a submitted batch after syntax passes.
Key Codes:
Common Issues:
Missing provider numbers (21)
Invalid diagnosis codes (187)
Duplicate claims (42)
Rendering provider not enrolled (85)
Early error detection = fewer denials
Real-time visibility into claim movement
Foundation for EDPS compliance
Best Practices
Automate parsing and alerts for 999/277 responses
Track rejection trends by error code
Map TRNs to original claim IDs for quick troubleshooting
The MAO-001 identifies duplicate encounter data submitted by MAOs to CMS.
It is triggered whenever a 98325 – Service Line(s) Duplicated error appears on your MAO-002 report.
Although not a direct risk-adjustment file, it ensures data integrity by flagging duplicate encounters that could distort payments.
Purpose
Lists duplicated ICNs and service lines.
Helps MAOs reconcile and correct duplicate records via void or replace transactions.
Maintains clean encounter data for risk-adjustment accuracy.
File Structure
How to Use
Match 98325 errors from MAO-002 to entries in MAO-001.
Validate true vs. false duplicates.
Resubmit corrected void/replace transactions (837 frequency 7 or 8).
Investigate systemic duplicate creation issues.
Why It Matters
Prevents duplicate encounter counting.
Protects RAF and payment integrity.
Keeps audit trail clean and CMS-compliant.
Once your data passes EDFES, it moves into EDPS.
The MAO-002 shows what CMS accepted or rejected after business rule and RA validation.
-> Review both “Accepted with errors” and rejected lines — they can still affect downstream RA scoring.
Validate accepted encounters and error trends
Identify coding or data patterns affecting risk scores
Track RA-eligible diagnoses ahead of MAO-004
Monitor provider-specific rejection clusters
837 Claim File
   ↓
TA1  (Envelope check)
   ↓
999  (Syntax/Structure)
   ↓
277CA (Claim-level status)
   ↓
MAO-001 (Front-end acceptance)
   ↓
EDPS Processing
   ↓
MAO-002 (Encounter-level acceptance)
   ↓
MAO-004 (Final RA/Payment reconciliation)
Each stage builds validation confidence — from structure → content → payment readiness.
1. Automation & Monitoring
Parse 999/277/MAO files automatically into a central repository
Track ICN continuity from submission to payment
2. Error Management
Build dashboards for error frequencies
Trend by provider, diagnosis, or error code
3. Operational Governance
Maintain audit trail linking 837s to MAO-002 and MAO-004
Validate chart review linkage before submission
4. Timeliness
Adhere to 13-month and 25-month deadlines
Monitor CMS “cleanup runs” or system announcements
The EDPS ecosystem is the lifeline of Medicare Advantage payments.
From the first 837 submission to the final MAO-004 reconciliation, every file — TA1, 999, 277, MAO-001, MAO-002 — tells part of your story.
By mastering each stage:
You reduce rejections and resubmissions
Improve encounter completeness
Strengthen audit defensibility
Protect risk score accuracy and revenue integrity
“In risk adjustment, every record counts — but only accepted encounters pay.”
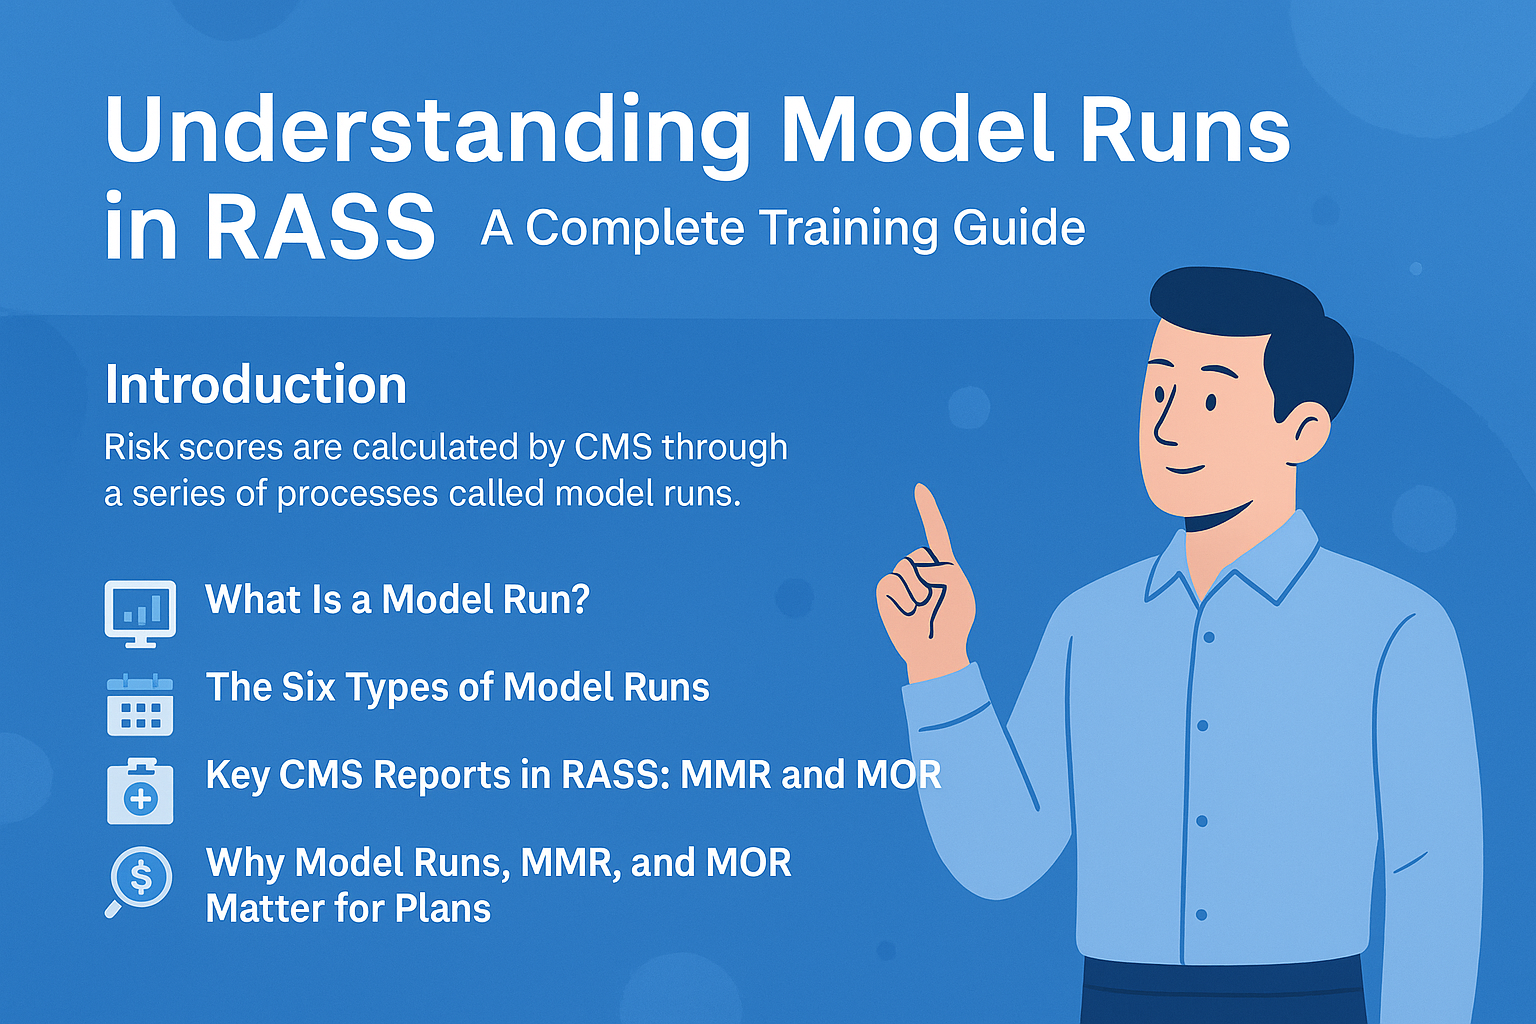
In Medicare Advantage and Part D, risk scores directly drive plan payments. These scores aren’t automatic — they are calculated through a series of scheduled and ad hoc processes inside CMS’s Risk Adjustment Suite of Systems (RASS).
These processes are called model runs.
Understanding how model runs work, and how their outputs (like the MMR and MOR) connect to payments and risk transparency, is essential for finance, operations, and compliance teams within Medicare Advantage Organizations (MAOs) and Prescription Drug Plans (PDPs).
A model run is the process by which CMS calculates risk scores using diagnosis and enrollment data within RASS.
Each model run includes the following steps:
Extracting diagnosis data from:
- EDPS (Encounter Data Processing System)
- RAPS (Risk Adjustment Processing System for PACE)
- FFS/IDR (Fee-for-Service / Integrated Data Repository)
Extracting demographic and enrollment data such as age, sex, Medicaid eligibility, disability, and institutional status from:
- BIC (Beneficiary Information on the Cloud)
- MDS (Minimum Data Set)
Applying the CMS-HCC model (V28 or blended version) to calculate the risk scores.
Producing outputs, including:
- MOF (Model Output File): Raw file containing demographics, HCCs, and interaction factors.
- RAF (Risk Adjustment Factor): Final risk score after normalization and coding adjustments.
- MORE (Model Output Report for MAOs): Summary of member-level demographics and diagnostic components.
These scores are transmitted to MARx, which applies them for Medicare Advantage and Part D payments.
CMS performs six distinct model runs each year, each with unique timing, purpose, and impact on plan payments.
Timing: September of the data collection year
Data window: July of the prior year → June of the data collection year
Purpose: Produces risk scores that determine payments for the first six months of the payment year.
Timing: March of the payment year
Data window: January – December of the data collection year
Purpose: Produces risk scores for the second half of the payment year.
Timing: February following the payment year (or as needed)
Purpose: Provides early reconciliation for the entire payment year.
Timing: August following the payment year (after interim final, if applicable)
Purpose: Produces final reconciled payments for the full year.
Timing: Ad hoc, post-final
Purpose: Corrects data or applies updated CMS business rules.
Timing: Ad hoc, as triggered by diagnosis deletions
Purpose: Adjusts payments by removing unsupported diagnoses and recouping overpayments.
A typical model run sequence follows this flow:
Initial Run: July (prior year) → June (data collection year) → Payments for first half of payment year
Midyear Run: January – December (data collection year) → Payments for second half
Interim Final Run: Post-payment year → Early reconciliation
Final Run: Post-payment year (August) → Final reconciliation
Cleanup/Overpayment Runs: Ad hoc adjustments as required
After each model run, CMS produces a set of output files and reports that bridge clinical validation, financial reconciliation, and audit transparency.
Two of the most important files MAOs receive are the MMR (Monthly Membership Report) and the MOR (Model Output Report).
RASS Output Flow:
EDPS/RAPS → RASS Model Run → MOF → MORE → MARx → MMR (Payments) + MOR (HCC Validation)
The MMR Detail File is the official CMS record that outlines monthly capitation payments, risk score logic, and adjustment activity for every beneficiary in a Medicare Advantage or Part D plan.
Tracks all capitated payments, retroactive adjustments, and risk factor updates.
Enables MAOs to validate CMS payments and ensure that demographic and clinical data align with their internal systems.
Format: Fixed-width, 495-character record layout
Delivery: Monthly
Content: 91 fields grouped into demographics, risk adjustment, payments, and adjustments
Contract/PBP/Segment IDs: Identify plan and region
RAF Fields (24–25, 46, 72–85): Risk factors used in calculation
ARC (Adjustment Reason Code): Explains why payment amounts changed
Cleanup ID: Tracks CMS-wide retroactive adjustments
ARC codes explain every change in CMS payments.
Key ones to monitor:
01: Death Notification (retro termination)
07: Retroactive Hospice
25: Part C RAF Reconciliation
36: Part D Rate Change
94: Cleanup-Related Adjustment
If your plan sees payment fluctuations — check ARC first. It’s your audit trail.
Revenue Validation: Confirm that RAFs and demographics align with expected CMS payments.
Compliance Readiness: Maintain documentation for all payment adjustments.
Risk Optimization: Identify coding gaps when default risk factors are used.
The CMS-HCC V28 model introduced major changes (2,200+ ICD code removals).
Plans must monitor:
ARC 25/26/37/41 increases tied to recalibrated RAFs.
Default risk factor codes triggered by missing or partial risk data.
Bottom Line:
The MMR is your financial control center. It reveals how CMS’s model outputs turn into real dollars — and how to reconcile every adjustment.
The MOR is CMS’s official feedback file showing which of your submitted diagnoses actually became paying HCCs after hierarchy and filtering.
Provides transparency into which diagnoses triggered HCCs.
Validates that your submissions were accepted and applied correctly.
Serves as your primary audit defense document during RADV or reconciliation.
MOR Report (HCCMODR):
Human-readable
Ideal for smaller plans or manual validation
MOR Data File (HCCMODD):
Fixed-width, 200-byte (Part C) or 168-byte (Part D)
Designed for automation and dashboard integration
Monthly MORs: Reflect live model runs (Jan–Jun and Jul–Dec).
Final MOR: Released after the final model run — used for appeals and audit reconciliation.
Submit: Member has diagnosis E11.9
Map: CMS maps to CC 19
Group: CC 19 → HCC 19 (Diabetes)
Filter: CMS applies hierarchy (drops lower-level codes)
Pay: HCC 19 triggers on MOR = payment earned
Non-specific ICD-10 codes not mapping to a payment HCC
Hierarchy overrides by more severe conditions
Late or improperly formatted submissions
Invalid encounter structure
Coding Accuracy: Identify diagnoses that didn’t trigger payments.
Revenue Assurance: Cross-check with MMR to ensure payment alignment.
Provider Education: Use MOR data to guide documentation improvements.
Audit Preparation: MOR = CMS’s proof of record for every payment-impacting diagnosis.
Bottom Line:
The MOR is your clinical mirror — it tells you exactly how CMS interpreted your diagnoses and which ones drove revenue.
Revenue Forecasting: Model runs and MMR trends reveal payment cycles.
Compliance Tracking: ARC and MOR exclusions show documentation gaps.
Audit Defense: MORE and MOR link diagnoses → HCCs → payments.
Operational Accuracy: MMR ensures payments align with member data; MOR ensures diagnoses align with payments.
Financial Planning: Joint use of MMR and MOR provides full-cycle visibility into risk adjustment operations.
1. Which model run determines payments for the first half of a payment year?
A. Initial Run.
2. What is the purpose of the MOR?
A. To show which diagnoses triggered paying HCCs.
3. What file should you review to find the reason behind a payment change?
A. MMR — Check the ARC (Adjustment Reason Code).
4. When does CMS typically run the Final Model Run?
A. August following the payment year.
5. What is the relationship between MMR and MOR?
A. MMR shows payment adjustments; MOR shows which diagnoses drove them.
Always validate MMR and MOR files together — they complete the payment picture.
Monitor ARC codes and default risk factors monthly.
Use MOR insights to drive provider training and coding specificity.
Track CMS model run schedules to anticipate payment adjustments.
Maintain audit-ready documentation across RASS, MARx, and MMR/MOR.
Model Run Inputs: EDRA (encounter/chart), RAPS (PACE), FFS/IDR, BIC, MDS.
Outputs: MOF → MORE → MARx → MMR/MOR.
Overpayment Logic: Triggered by deletes; reconciled in Cleanup runs.
Operational Tip: Late submissions only apply in the next model run — track all cutoff dates.
Audit Tip: MORE + MOR + MMR = complete CMS validation trail for plan payments.
Model runs, MMR, and MOR form the backbone of CMS’s risk adjustment ecosystem.
Together, they connect clinical documentation → diagnosis coding → risk scoring → payment flow.
By mastering this cycle, Medicare Advantage plans can ensure payment accuracy, compliance integrity, and operational excellence — from diagnosis to dollar.
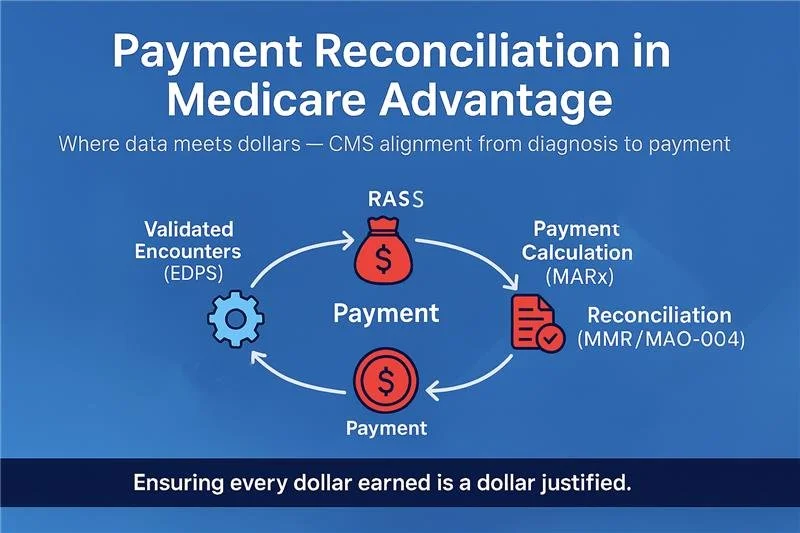
In Medicare Advantage (MA), risk adjustment doesn’t end with a model run — it ends with payment reconciliation.
Payment reconciliation is where data meets dollars. It’s the process through which CMS aligns all plan payments with validated enrollment, diagnosis, and risk score data — ensuring every cent reflects actual member risk and eligibility.
For MAOs, mastering this process is vital. Reconciliation affects cash flow, revenue forecasting, audit preparedness, and even plan performance ratings.
This guide breaks down the entire reconciliation process — from model outputs to MARx adjustments — and how to use CMS reports like MMR, MORE, and MAO-004 to maintain financial accuracy and compliance.
Payment reconciliation sits at the intersection of multiple CMS systems. Understanding each system’s role is key:
RASS (Risk Adjustment Suite of Systems)
Calculates risk scores from submitted diagnoses and model runs (Initial, Midyear, Interim, Final). Outputs: MOF, RAF, and MORE.
EDPS (Encounter Data Processing System)
Processes encounter-level claim data from MAOs. Feeds validated diagnoses to RASS for risk adjustment scoring.
MARx (Medicare Advantage and Prescription Drug System)
Applies risk scores, enrollment status, benchmark rates, and rebates to generate monthly plan payments.
MMR (Monthly Membership Report)
The financial DNA of your plan — showing capitation, adjustments, rebates, and risk factor details for every member.
MAO-004 (Risk Adjustment Data Validation File)
Reflects final diagnosis acceptance and payment adjustment information used for risk score reconciliation.
Together, these systems ensure CMS payments are accurate, traceable, and supported by compliant data.
Payment reconciliation is the process of aligning CMS payments with the most current and validated data available.
It involves systematically updating plan payments based on:
Member eligibility and enrollment changes
Updated demographic or risk adjustment factors
Results of RASS model runs
RADV and overpayment recoveries
Late-submitted encounters or corrections
CMS performs this reconciliation through scheduled model runs and ad hoc adjustments, ultimately leading to a Final Reconciliation for the Payment Year.
A key concept in understanding reconciliation is the offset between data collection and payment.
Data Collection Year: The calendar year in which services are rendered and diagnoses are submitted (e.g., 2024).
Payment Year: The year following, when CMS uses those diagnoses to calculate payments (e.g., 2025).
This lag allows CMS to process all encounters, corrections, and RADV adjustments before determining the final payment.
CMS conducts several model runs that culminate in final payment reconciliation:
1. Initial Model Run
Performed in September of the data collection year
Uses partial encounter data (July prior year – June current year)
Sets payments for the first half of the payment year (January–June)
2. Midyear Model Run
Performed in March of the payment year
Uses full calendar year encounter data (Jan–Dec)
Adjusts payments for July–December
3. Interim Final Run
Conducted in February after the payment year
Provides early reconciliation of all payments for that year
4. Final Model Run
Conducted in August following the payment year
Reflects the definitive risk scores and payments for that period
5. Cleanup & Overpayment Runs
Ad hoc runs triggered by RADV results, deletes, or systemic corrections
Ensure post-final adjustments are properly reconciled
CMS integrates multiple data streams into reconciliation calculations:
EDPS Data: Encounter-level records used for primary risk score calculation
RAPS Data: Legacy summary data (still partially used for blend years)
MAO-004 Files: Confirmed diagnosis-level risk adjustment data
MMR Files: Reflect all capitation payments, rebates, and adjustments
MORE Reports: Monthly summaries of model output and risk score derivations
RADV Results: Overpayment recoveries and deletions integrated post-audit
Together, these ensure that every dollar paid is supported by a valid, auditable diagnosis record.
At each model run and reconciliation stage, CMS recalculates payments using this general logic:
Final Payment = (Base Rate + Rebates + Add-ons) × Normalized RAF × (1 − Coding Adjustment)Where:
Base Rate: County benchmark or bid rate
RAF: Derived from the latest RASS output
Normalization Factor: Adjusts scores so national average = 1.0
Coding Adjustment: CMS adjustment for documentation patterns across MA vs. FFS
CMS uses MARx to apply these calculations and issue monthly payments reflected in the MMR file.
Late-submitted or corrected encounters
Member retroactive disenrollment or death notifications
Risk score recalculations (post-RASS updates)
Chart review additions or deletions
RADV overpayment recoveries
CMS Cleanup Model Runs
Each event prompts recalculation of risk scores and adjustments in MARx payment streams.
Encounter submitted via EDPS
Diagnosis accepted and mapped to HCC
RASS model run produces RAF and MOF
MARx applies risk score and demographic data to payment
MMR reflects updated payment and ARC codes
RADV deletes trigger overpayment adjustment
Final Model Run reconciles all data sources
The result: each beneficiary’s payment reflects real, validated, and auditable data — nothing more, nothing less.
Financial Accuracy
Ensures every payment is based on verified diagnoses and correct demographics.
Compliance & Transparency
Aligns plan data with CMS audit requirements (RADV, OIG, and internal audits).
Forecasting & Budgeting
Enables accurate RAF and revenue projections for finance teams.
Audit Readiness
Ensures MAOs can trace every payment to source data and supporting documentation.
Operational Integrity
Encourages proactive data correction and timely submission practices.
Late encounter submissions missing cutoff dates
Improperly linked chart reviews (causing rejected diagnoses)
Incorrect or missing provider identifiers in EDPS files
RAPS/EDPS blending confusion (especially during transition years)
Failure to monitor ARC codes in MMR files
Unresolved RADV findings not reflected in financial ledgers
Each issue can create discrepancies between CMS-calculated and MAO-expected payments.
Align Operations and Finance Teams
Ensure coding, reconciliation, and accounting teams share a unified data view.
Automate File Tracking
Monitor EDPS → MAO-002 → MAO-004 → MMR chain using dashboards.
Validate Monthly
Compare internal RAFs with CMS MORE and MMR outputs.
Watch Cleanup Runs
Cleanup and overpayment runs can trigger unexpected payment shifts — plan reserves accordingly.
Leverage Technology
Use ETL pipelines to link encounter IDs, HCCs, RAFs, and payments end-to-end.
Document Everything
Maintain clear audit trails from ICD-10 codes to payment records.
Payment Reconciliation is the finish line of the risk adjustment lifecycle.
From EDPS submissions to RADV recoveries, it’s where every data point meets financial accountability.
Plans that actively track their reconciliation events, validate their CMS outputs, and maintain complete audit documentation are those that thrive — not just survive — under CMS scrutiny.
“Reconciliation ensures every dollar earned is a dollar justified.”
By mastering this process, your organization can confidently connect data, compliance, and dollars — the foundation of sustainable Medicare Advantage operations.
In Medicare Advantage (MA), risk scores directly drive plan payments — but accuracy is everything.
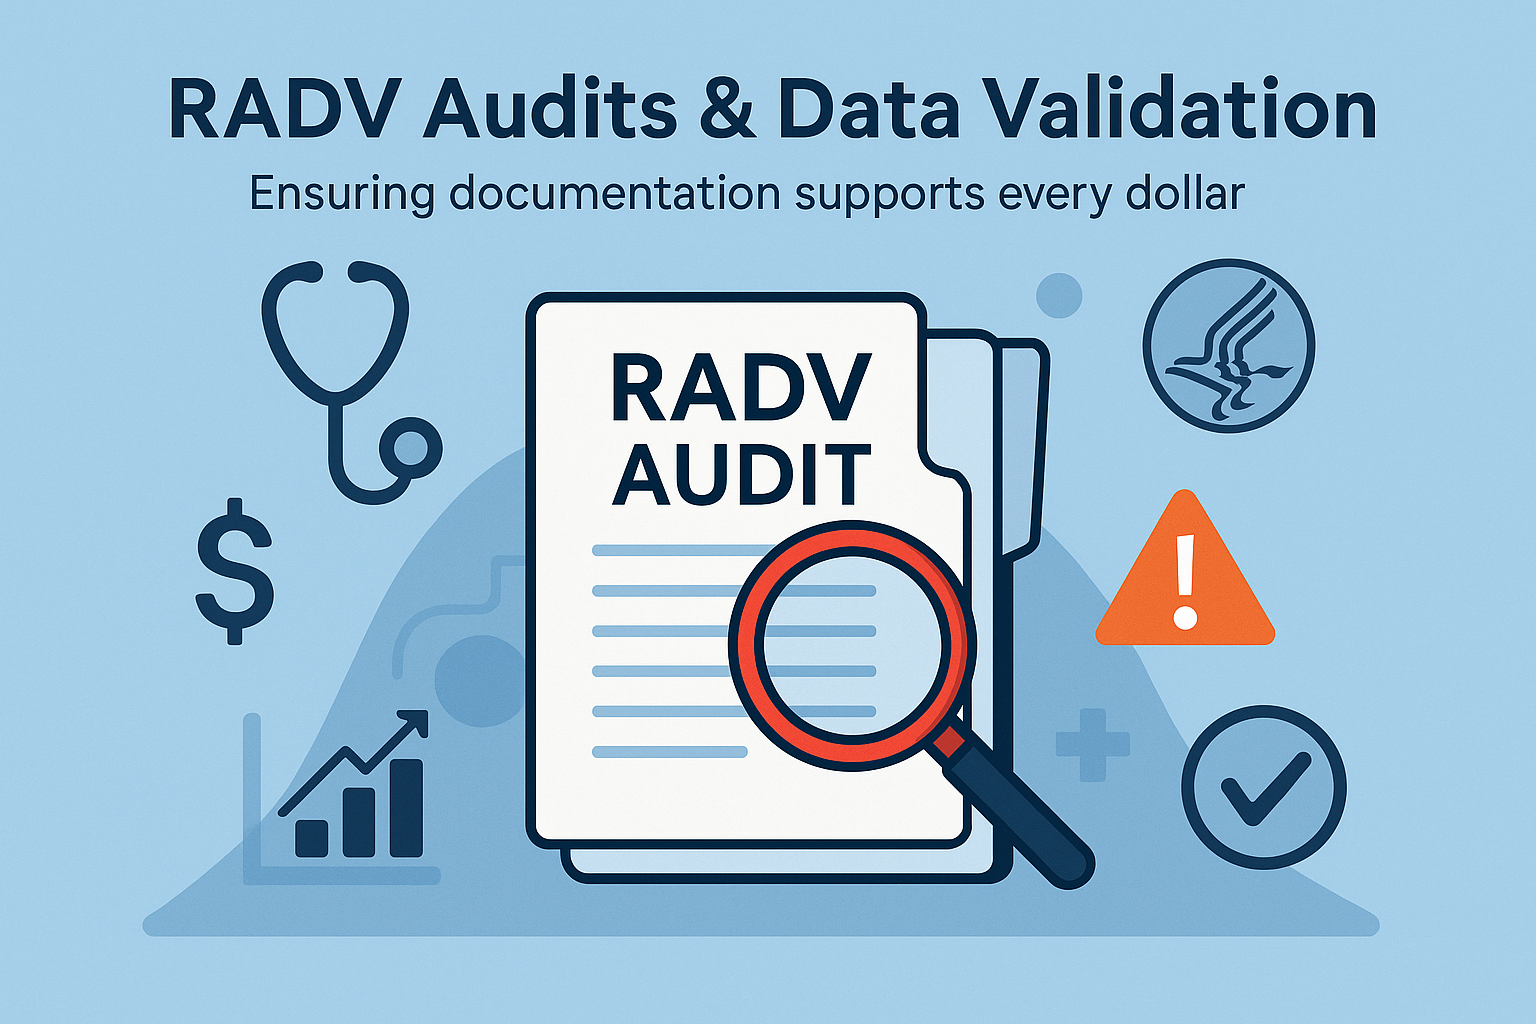
When CMS suspects that submitted diagnoses may not be fully supported by medical documentation, it initiates a Risk Adjustment Data Validation (RADV) audit.
The RADV audit process ensures that every dollar paid to MAOs aligns with the true clinical documentation in beneficiary medical records.
Understanding how RADV works — from sampling and validation to extrapolation and overpayment recovery — is essential for MA compliance, finance, and risk adjustment teams.
Risk Adjustment Data Validation (RADV) is CMS’s audit process used to confirm that diagnoses submitted for risk adjustment are supported by medical records.
The goal:
To verify that Medicare Advantage Organizations (MAOs) receive appropriate payments — not more, not less — based on accurately documented conditions.
RADV audits are required under:
Social Security Act §1853(a)(1)(C)
42 CFR §422.310(e)
CMS performs these audits to detect errors, calculate payment discrepancies, and ensure compliance with risk adjustment data submission and documentation standards.
1. Contract-Level RADV (CL-RADV)
Conducted at the contract level (H-number)
Statistically valid sample of enrollees
Extrapolation applied across contract payments
Used by CMS as the primary audit mechanism since PY 2018
2. National RADV (NRADV)
Nationwide review across multiple plans
Used for model calibration, research, and quality control
3. Targeted or OIG-Led RADV
Conducted by the Office of Inspector General (OIG)
Focused on high-risk areas or conditions showing anomalous coding patterns
1. Notification
CMS notifies selected MAOs via official correspondence.
Each contract receives a sample of enrollees for review.
2. Medical Record Submission
MAOs submit medical records to the CMS Central Data Abstraction Tool (CDAT).
Records must be legible, complete, and properly linked to each diagnosis submitted.
MAOs typically have 12–16 weeks to submit documentation.
3. Validation
CMS and its contractors review records against the submitted diagnoses.
Each diagnosis is classified as:
Confirmed — Supported by the medical record
Discrepant — Documentation mismatch or incomplete
Invalid — No support found
Confirmed Higher/Lower — Hierarchy or specificity differs
4. Error Rate Calculation
CMS computes an enrollee-level payment error by comparing the payment-weighted risk scores for confirmed vs. unconfirmed conditions.
5. Extrapolation
The contract-level error rate is extrapolated from the audited sample to all members under that contract.
This step began with Payment Year 2018, as finalized under the RADV Final Rule (CMS-4185-F2).
6. Appeal and Recovery
MAOs may appeal findings within established timelines.
CMS issues an Extrapolated Overpayment Recovery Notice for confirmed payment errors.
Payment adjustments follow if no appeal is sustained.
Derived from the Payment Error Calculation Methodology (2025 update):
CMS calculates each enrollee’s difference between original and validated risk scores.
All enrollee differences are aggregated into a contract-level mean error.
The mean error is multiplied by the total contract population to determine the estimated total payment error.
No “fee-for-service adjuster” is applied — CMS now uses actual MA data only.
Formula (simplified):
Payment Error = (Σ Validated RAF - Σ Submitted RAF) / n * Contract Enrollee CountDuring review, each diagnosis receives one of several possible results:
✅ Confirmed — Supported exactly as submitted
⚠️ Discrepant — Supported by record but coded to a different HCC
❌ Invalid — Unsupported diagnosis or incorrect documentation
⬆️ Confirmed Higher — More specific diagnosis found (e.g., diabetes with complications instead of unspecified)
⬇️ Confirmed Lower — Less specific or downgraded version validated
Each enrollee’s results contribute to the overall sample error rate, which is the foundation for contract-level extrapolation.
Per Section 1128J(d) of the Social Security Act, MAOs must report and return overpayments within 60 days of identification.
If RADV identifies overpayments, plans are required to:
Validate internally whether additional contracts are affected.
Correct and report identified overpayments to CMS.
Maintain documentation demonstrating compliance.
Under 42 CFR §422.504(d) and (i), MAOs must:
Retain supporting documentation for 10 years after the final payment determination.
Maintain audit-ready records linking each submitted diagnosis to a valid medical record.
Ensure each record includes patient name, date of service, provider signature, and credentials.
Incomplete or unsigned records are automatically considered invalid for RADV validation.
CMS uses statistically valid sampling methods (as detailed in your uploaded Contract-Level RADV FAQ).
Each sample is randomly drawn from the contract’s enrollee population.
Stratification ensures representation across key variables (age, gender, HCC profile).
Extrapolation applies only to Payment Year 2018 and onward.
CMS no longer applies the “FFS Adjuster” methodology — aligning MA audits more closely with commercial audit standards.
Request for Reconsideration (Reopenings)
MAOs can request review of findings and submit additional documentation.
CMS Reconsideration Determination
CMS issues an official determination following internal review.
Hearing Official Review (2nd Level)
Independent Hearing Official reviews disputes on methodology or evidence.
Final Agency Decision
The CMS Administrator or delegate issues a final decision.
Payment recovery follows, and MAOs must comply with debt collection procedures under 45 CFR Part 30.
Coding without documentation: Diagnoses reported but not supported by the chart.
Incorrect provider type: Notes signed by unqualified providers.
Date mismatches: Documentation not matching the service year.
Illegible or incomplete records: Missing key identifiers or signatures.
Unsupported hierarchical coding: Submitted at higher specificity than documented.
Chart Review linkage errors: Missing or mislinked chart reviews to encounters.
Maintain clear traceability: ICD → HCC → medical record evidence
Audit internal submissions monthly against CMS reporting
Train coders on RADV audit findings and documentation rules
Automate error tracking from MAO-002 and RADV reconciliations
Prepare an “Audit Binder” — a consolidated record of all documentation tied to each diagnosis submission
CMS RADV Resources Portal
RADV Final Rule (CMS-4185-F2, January 2023)
[RADV Sampling & Calculation Methodology Memo, May 2025]
[CMS Medicare Managed Care Manual, Chapter 7, §40 – Risk Adjustment Data Validation]
RADV is not just an audit — it’s a system-wide check on data integrity and compliance.
Every plan’s financial accuracy, audit readiness, and CMS reputation depend on maintaining precise, well-documented diagnosis reporting.
In Medicare Advantage, documentation drives payment — and RADV ensures the documentation stands behind every dollar.
By mastering the RADV process — from EDPS submission to extrapolated overpayment reconciliation — your team can stay ahead of compliance risk and build a sustainable, audit-ready risk adjustment operation.
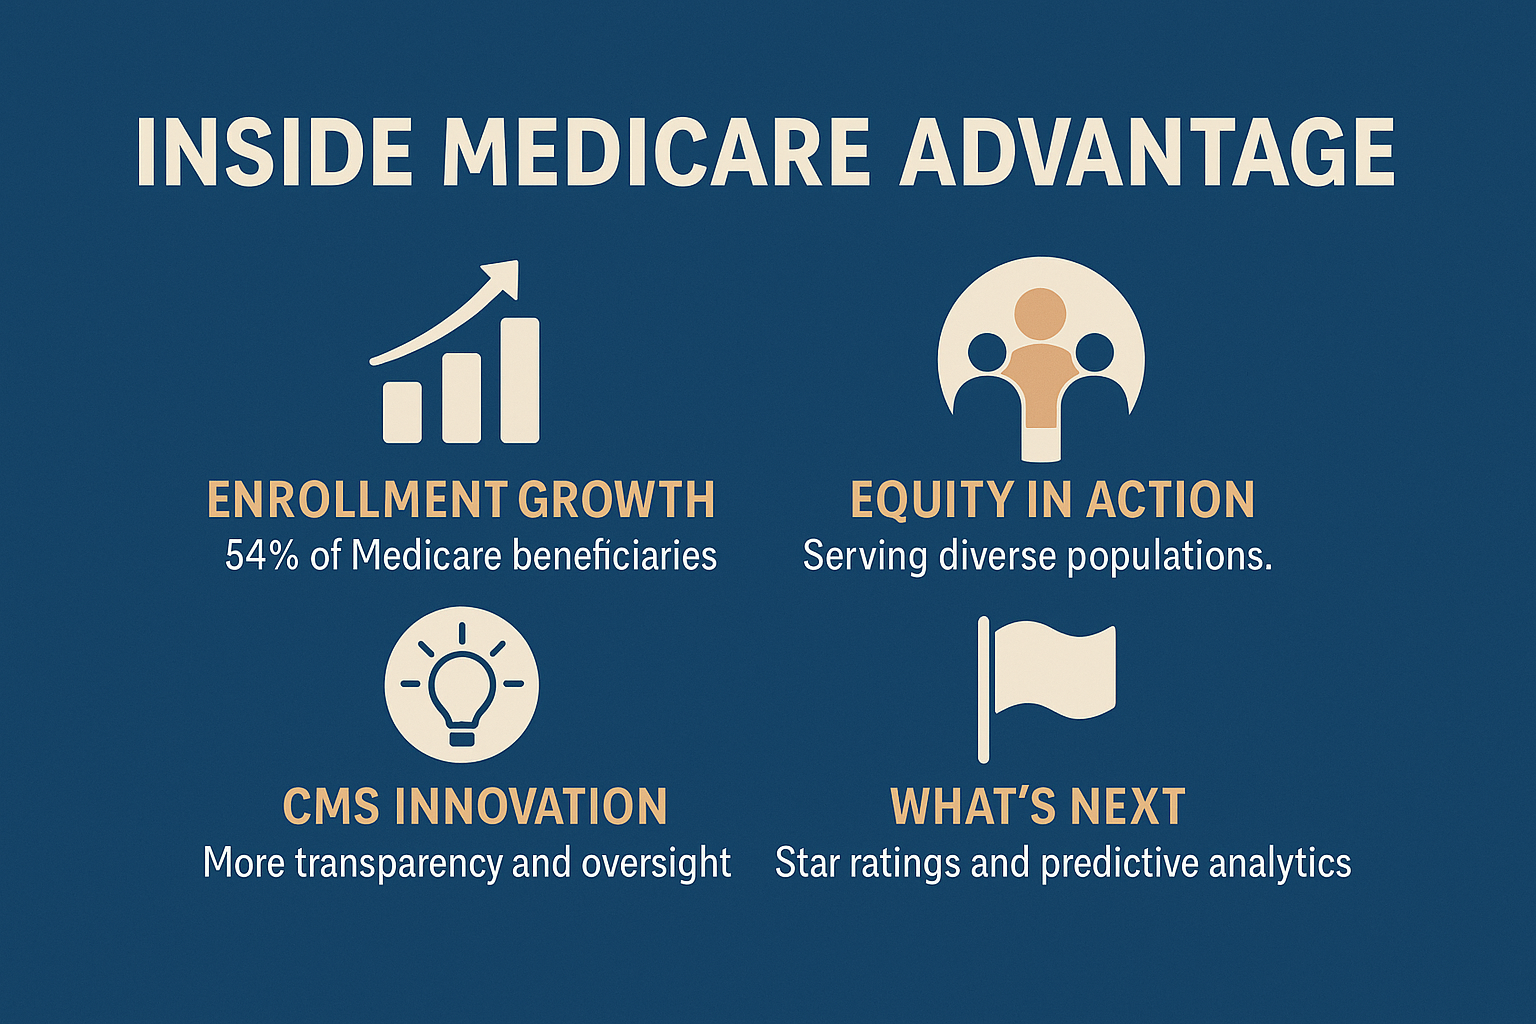
More than 33 million Americans are now enrolled in Medicare Advantage (MA) — and that’s not just a statistic, it’s a transformation.
In 2025, for the first time in history, over half of all Medicare-eligible seniors (54%) are choosing MA over traditional Medicare.
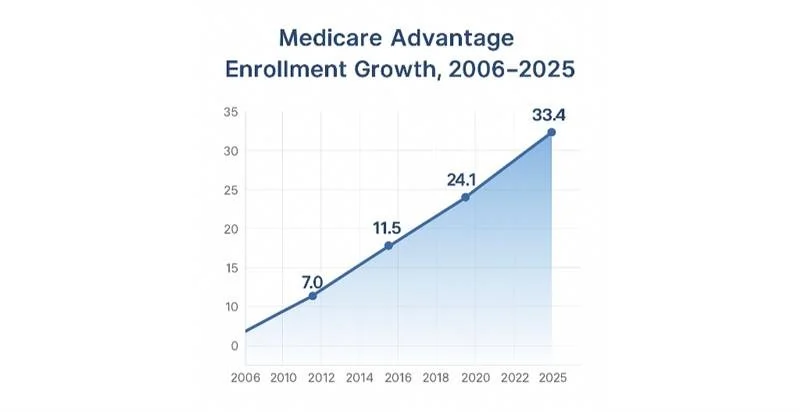
Medicare Advantage enrollment growth, 2006–2025
This massive shift reflects more than cost and coverage. It’s about simplicity, access, and personalization.
The latest trends show a program that’s not only growing fast but reaching deeper into underserved populations:
52% of enrollees have incomes below $30,000.
Nearly half identify as racial or ethnic minorities.
Over 20% are dually eligible for Medicare and Medicaid.
In other words — Medicare Advantage isn’t just expanding. It’s democratizing access to coordinated care.
Let’s face it: navigating traditional Medicare can feel like trying to read a 500-page manual in another language.
Medicare Advantage simplified that — and seniors noticed.
Surveys continue to show that:
94% of MA enrollees are satisfied with their coverage.
80% report lower out-of-pocket costs.
85% say they’re getting better coordinated care than before.
So what’s driving the love?
Predictable spending: Annual caps on out-of-pocket costs.
Extra benefits: Dental, vision, hearing, meals, transportation — all rolled in.
One-stop simplicity: Parts A, B, and D bundled under one plan.
Preventive focus: Plans are incentivized to keep people healthy, not just treat illness.
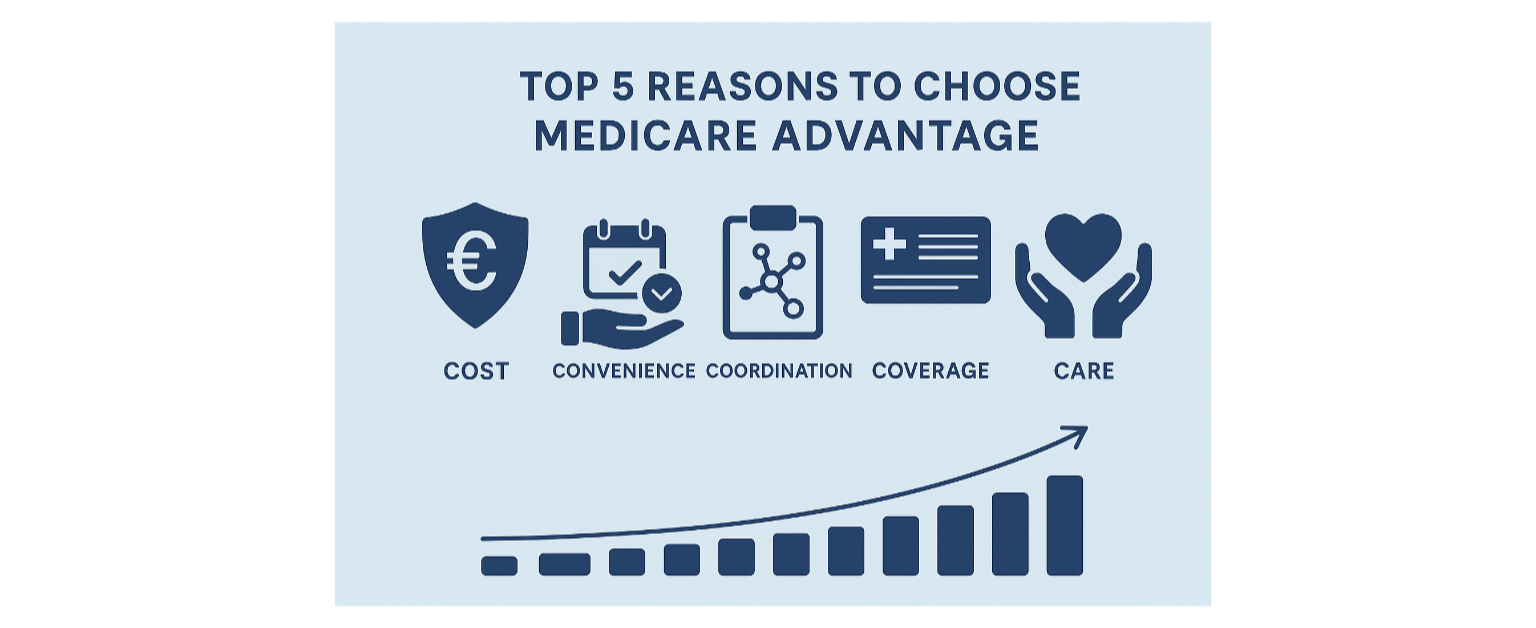
Top 5 reasons members stay with Medicare Advantage
The result? Fewer hospitalizations, better chronic disease management, and higher satisfaction year after year.
Perhaps the most underreported success story of MA is how well it serves diverse and low-income communities.
Recent data highlights how Medicare Advantage plans have:
Narrowed racial disparities in hypertension control and diabetes management.
Improved preventive care rates in Black and Hispanic populations.
Expanded access to telehealth, which jumped over 30% since pre-pandemic levels.
That’s not just a quality story — it’s an equity story.
Traditional Medicare still struggles to reach these populations effectively, but MA’s flexibility and supplemental benefits make it possible.
“Medicare Advantage is closing gaps in care not through slogans, but through structure.”
— Health Data Max Editorial
A closer look at enrollment data shows where this growth is happening — and who’s driving it.
One in two Medicare beneficiaries nationwide is now in an MA plan.
Enrollment is especially concentrated in Florida, Minnesota, Ohio, and Pennsylvania, where MA penetration exceeds 60%.
Five parent companies — including UnitedHealth, Humana, CVS/Aetna, Kaiser Permanente, and Elevance — account for roughly three-quarters of total MA enrollment.
Regional and community-based plans continue to thrive, often driving innovations in care delivery and chronic management.
Market Share by Parent Company — 2025 MA Enrollment
Even as national consolidation grows, competition remains fierce at the local level.
Counties across the U.S. now have dozens of MA plan choices, with some urban areas offering over 60 plans per beneficiary.
Choice is good — but it means CMS has to keep a closer eye on consistency, quality, and oversight.
In 2025, CMS added a new layer of accountability through the Medicare Part C Utilization Management (UM) Annual Data Submission.
It sounds bureaucratic — but it’s actually a major modernization move.
Starting with the April 2026 submission cycle, every MA plan must report:
Which Part C services require prior authorization.
The coverage criteria used for medical necessity decisions.
How Part B drugs and specialty procedures are managed.
Which internal policies differ from national or local coverage determinations (NCDs/LCDs).
CMS will collect this data through the Health Plan Management System (HPMS) — and while they dropped the proposed “audit protocol” for now, that’s likely a temporary reprieve.
“This isn’t another audit—it’s a flashlight. CMS is asking plans to show how the rules are applied, not just if they’re followed.”
— Health Data Max
What’s the goal? Transparency.
CMS wants to make sure medical management aligns with national standards and doesn’t become a barrier to medically necessary care.
Let’s break this down into practical steps for Medicare Advantage organizations.
By April 2026, plans should:
Map internal coverage policies to ensure every prior authorization aligns with CMS criteria.
Centralize documentation — build a structured repository for all UM and clinical decision policies.
Implement submission workflows through HPMS, tested for compliance.
Review denials and appeals to identify systemic inconsistencies.
Use automation and AI validation tools to pre-verify data before submission.
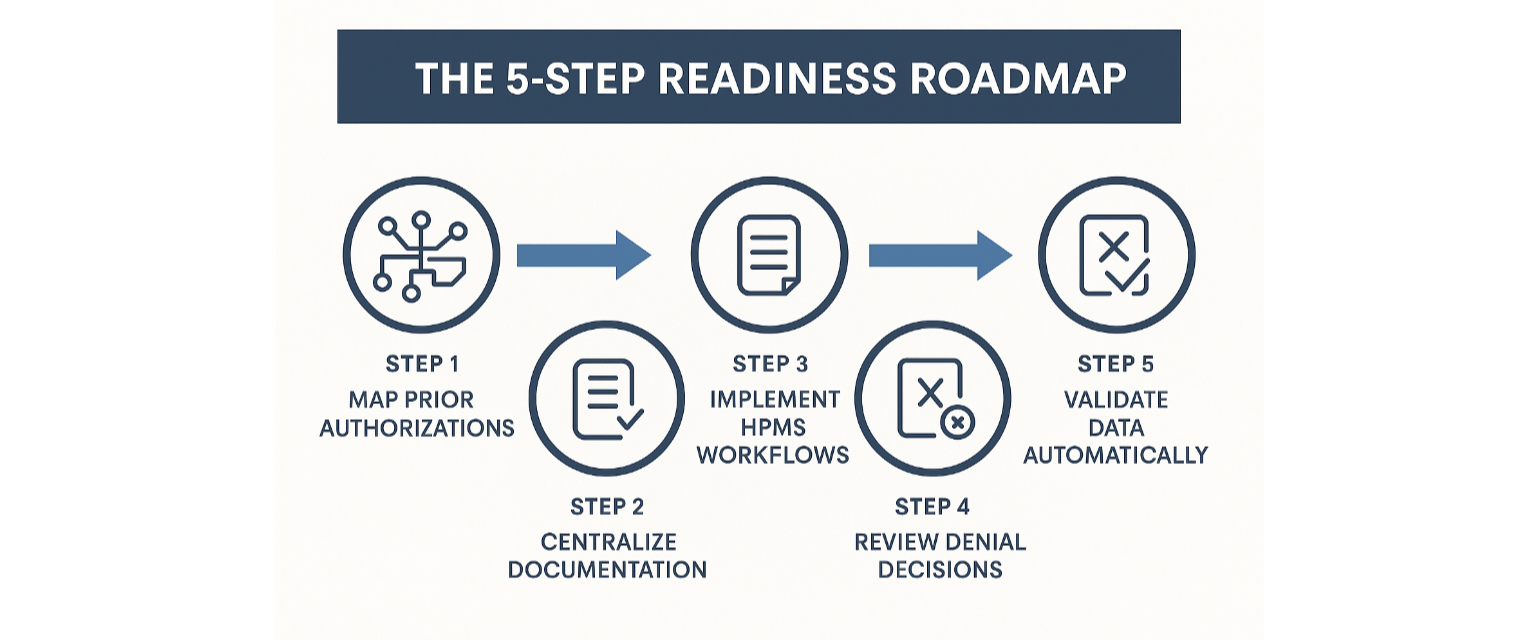
The 5-Step Readiness Roadmap
Even though CMS paused the audit portion, this requirement essentially turns every submission into an audit-ready file.
Plans that treat it that way will avoid surprises when oversight expands in 2027.
While the UM data collection takes center stage in 2025, CMS’s risk adjustment evolution continues in parallel.
The CMS-HCC V28 model is now being phased in fully by 2026, with updated mappings, constrained hierarchies, and normalization adjustments.
That means:
Diagnoses that used to map to one HCC may now split or share coefficients.
Average Risk Adjustment Factors (RAFs) may shift downward slightly as coefficients stabilize.
CMS is gradually transitioning from SAS to Python-based models, modernizing the underlying software and validation process.
“Why the V28 transition matters — It’s not just math, it’s measurement.”
This new environment makes data accuracy a strategic advantage.
Plans that build audit trails from member chart to CMS submission will outperform peers on both payment integrity and compliance confidence.
This is where Agentic AI and fine-tuned Large Language Models (LLMs) step into the Medicare Advantage world.
Imagine a system that:
Reads CMS submission files like an auditor.
Cross-checks prior authorization criteria with real-time claims and chart data.
Flags missing HCC support before it ever reaches CMS.
Summarizes documentation using RADV and MEAT logic automatically.
That’s not science fiction.
It’s how leading risk adjustment platforms, like Health Data Max, are reinventing operational validation.
AI in Medicare Advantage isn’t about replacing people — it’s about replacing blind spots.
It’s the difference between reactive compliance and continuous assurance.
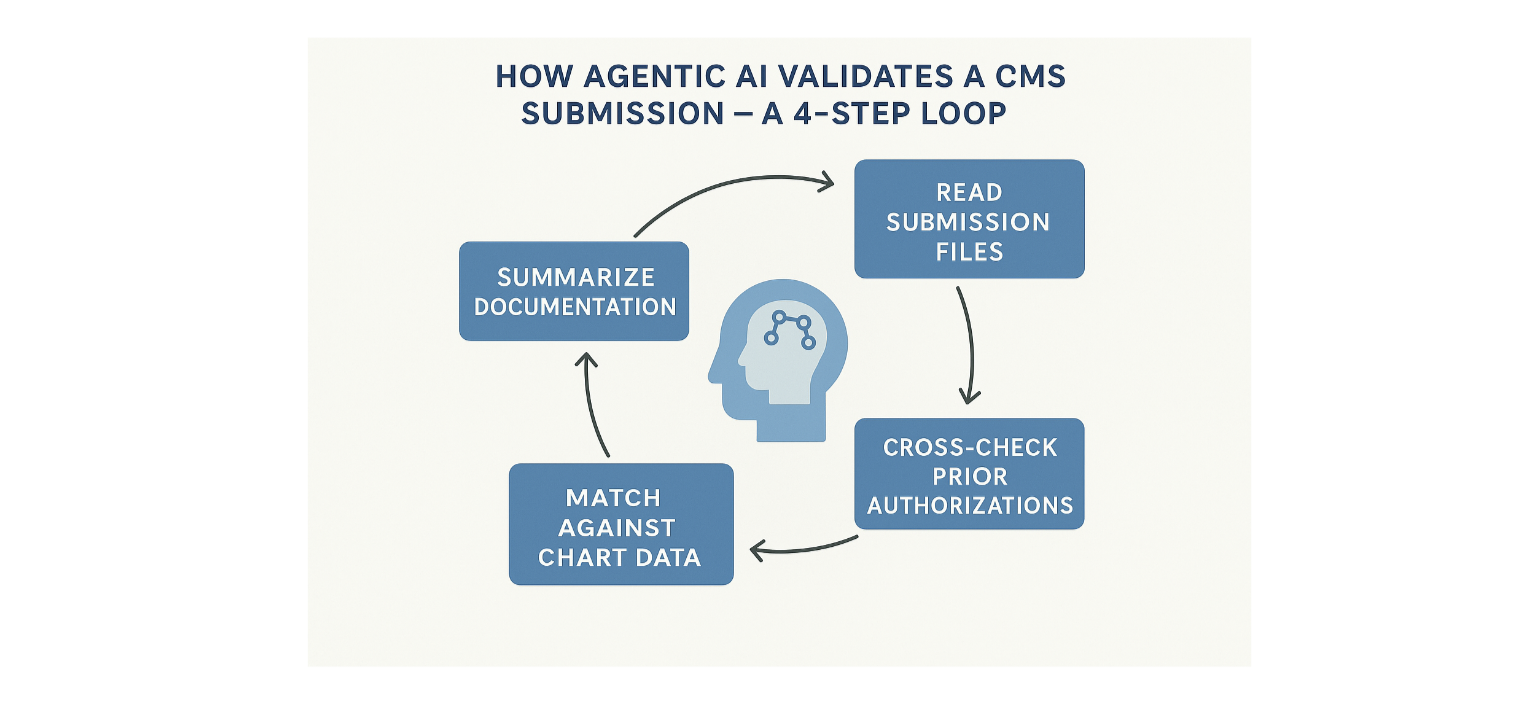
How Agentic AI Validates a CMS Submission
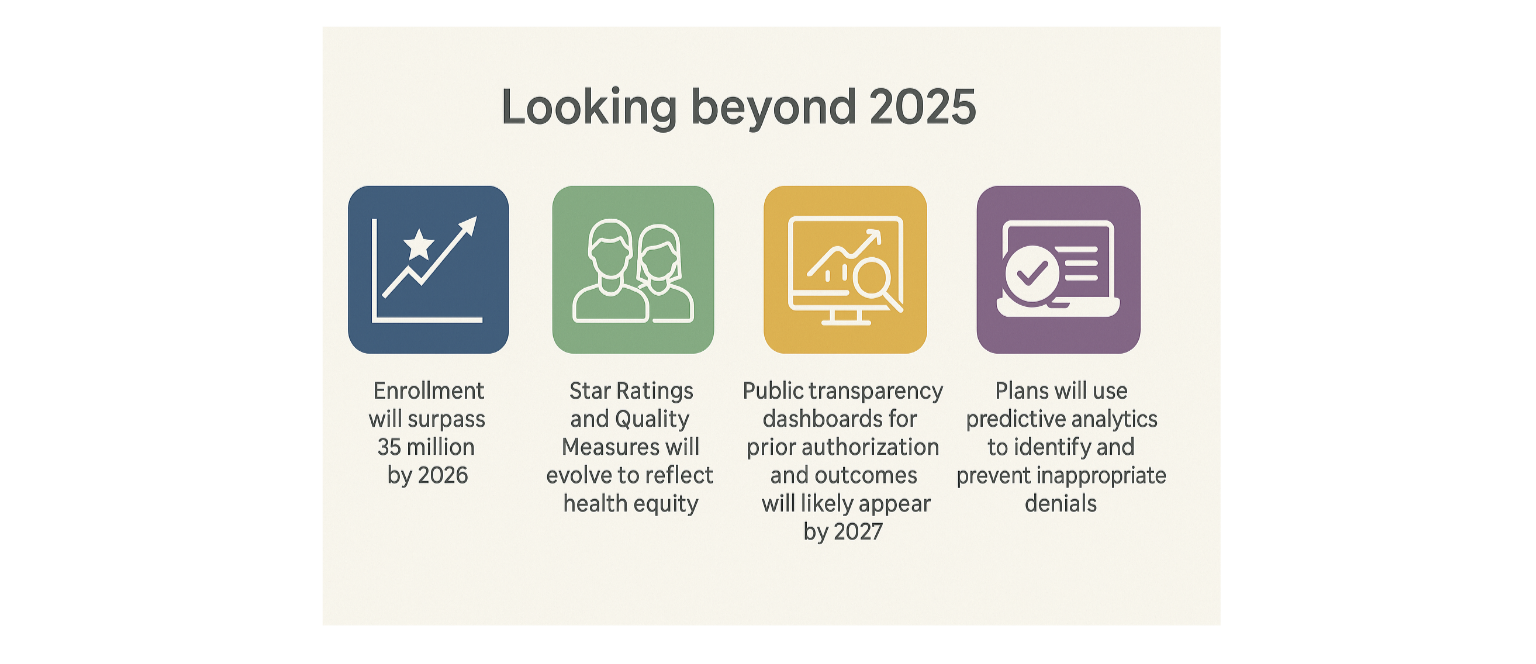
Looking beyond 2025, the trends are clear:
Enrollment will surpass 35 million by 2026.
Star Ratings and Quality Measures will evolve to reflect health equity.
Public transparency dashboards for prior authorization and outcomes will likely appear by 2027.
CMS will expect plans to use predictive analytics to identify and prevent inappropriate denials.
Medicare Advantage is becoming a smart ecosystem — one that rewards both performance and precision.
The next phase of growth won’t be about adding members; it’ll be about earning trust through clarity and accuracy.
Medicare Advantage 2025 proves two things can be true at once:
The program is thriving, driving satisfaction and equity like never before.
It’s also tightening, as CMS and the public expect transparency and fairness in every decision.
The future of Medicare Advantage will belong to organizations that embrace both sides — growth and governance.
“Medicare Advantage continues to deliver on its promise — better outcomes, lower costs, and broader access for America’s seniors.”
And as CMS makes the program more data-driven, that promise only gets stronger.
2025-State-of-Medicare-Advantage.pdf
Q. How is CMS increasing oversight for Medicare Advantage plans?
A: CMS has implemented a Medicare Part C Utilization Management Annual Data Submission requirement. Starting with the 2026 cycle, MA organizations must report, via HPMS, the internal coverage criteria they use to process Part C services that require prior authorization, including policies for Part B drugs. CMS’s stated aim is transparency and alignment with national Medicare coverage standards; while CMS did not finalize an audit protocol in the 2025 rule, the data may inform future oversight activities.
Q. What does the V28 Risk Adjustment model mean for plans?
A: The CMS-HCC V28 model updates ICD→HCC mappings, reorganizes some HCC families (including constrained/coefficient-sharing rules), and revises coefficients and normalization factors. Plans should expect mapping and coefficient changes that can alter RAF calculations; the model is being phased in per CMS guidance and some programs (e.g., PACE) may have special blends. Plans must ensure coding accuracy and maintain end-to-end audit trails.
Q. Why are Agentic AI and LLMs important for Medicare Advantage operations?
A: Agentic AI and fine-tuned LLMs are operational tools (not CMS mandates) that many organizations use to automate validation tasks: cross-checking CMS submission files, reconciling claims and chart documentation, flagging missing HCC support, and generating audit-ready evidence. These technologies can materially reduce manual errors and improve readiness for UM and risk-adjustment submissions — plans should treat them as augmentations to expert review. (CMS encourages accurate, auditable submissions but does not require specific automation approaches.)